Archive for the ‘online maps’ Category
Sunday, September 6th, 2009
One of the things we been looking recently on Geograph, is guageing how ‘recent’ our coverage actually is. We impose no restriction on when photos where taken – because historical images are useful – not to mention every photo is historic by definition as soon as its taken!

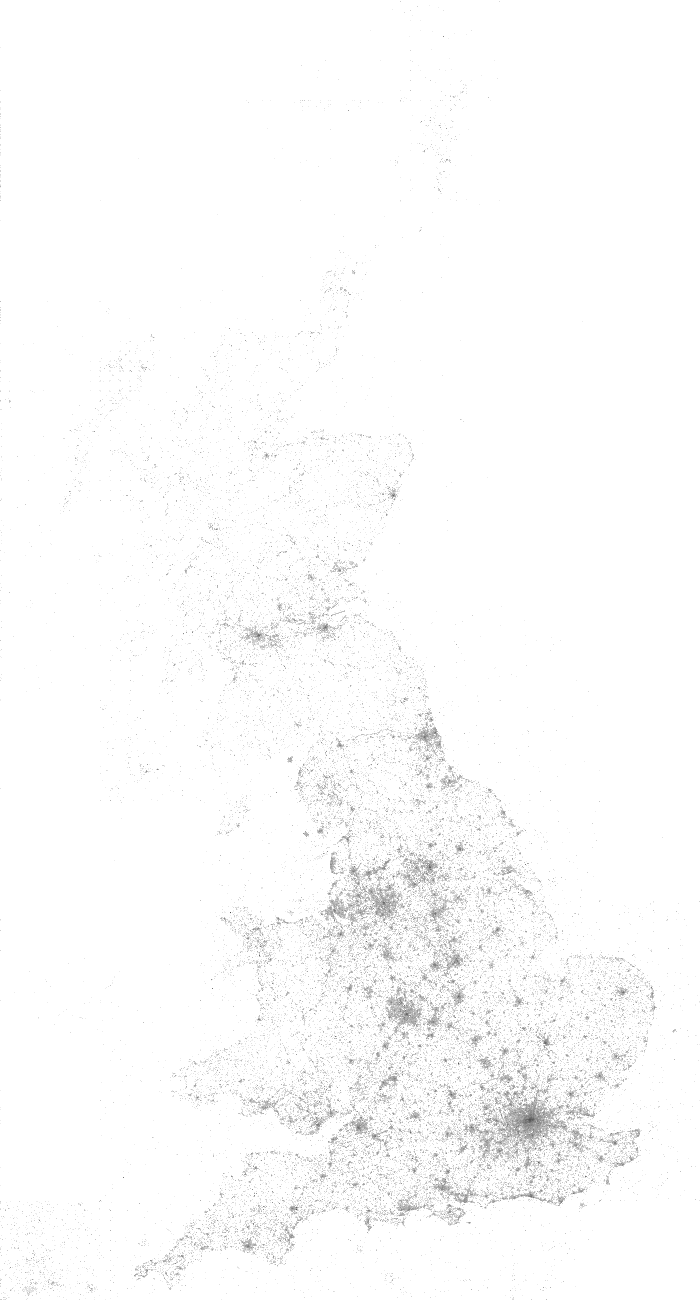
Anyway the point of this post is in the process decided to try plotting a map showing the ‘age’ of the latest photo in a square – to see that recentness. The result is here:
OMG, quite aside from what it shows, it looks beautiful. (To my untrained eye!)
Click the image for a glorious 1px per km version.
© Copyright 2009 Geograph Project and licensed for reuse under this Creative Commons Licence. (if you want to do anything with it!)
Key: Age less than in years: (0 means no photos yet)

There is also a whole series of rendered maps from the project.
Tags: colours, coverage, Geograph, map, pretty, UK
Posted in Geograph, maps, online maps | 3 Comments »
Wednesday, May 28th, 2008
Google has just announced a new Google Earth API – which allows embedding and fully functional Google Earth in just about any webpage. Even is easily intergratable with Google Maps API mashups – with very little extra code. (takes a number of seconds for that news to sink in!)
Be sure to checkout the samples, (particularly the milktruck demo!), I’ve also started trying it out with a few demos of my own…
…Windows only btw…
Expect A LOT MORE from this very flexible looking API – the JS interface can quickly interact with objects (API is based around KML) and gets pretty good control of interface options.
Update: mentioned on gearthblog.com which is a good introduction about what this is and what its not!
Update2: and to show it can basically be added to a ‘real world’ Gmaps mashup, in a few lines of code, see here
Tags: API, browser, Google Earth, javascript, plugin, web
Posted in API, geo, Google Earth, Google Maps, KML, online maps | 4 Comments »
Saturday, March 1st, 2008
 Nearby Coordinate Converter >>>
Following on from the Coverage map for Google Earth Layer usage, remembered I been keeping a log from the Coordinate Converter specifically for mapping (but only for GB) , but never actully got round to it, until now that is! Click the image for a full 1px per km version!

Update: Inspired by the above, heres one for the Geograph Search, ok so actully its for the British Isles!
<<<Geograph Searches
Posted in Coordinate Converter, maps, online maps, UK | 1 Comment »
Saturday, March 1st, 2008
Following part 1 yesterday, have now plotted some maps per individual service.
Flash Earth Layer

Conclusions
- Google Earth does request a link for the initial view on startup – that point in the Atlantic.
- I guess North American installs have two slightly different default placemarks; has it changed, or maybe Canada gets a different one?
- But that doesnt explain the lines from there – people must have their links set to periodically refresh?
- Germany likes FlashEarth (or rather people like looking at Germany with FlashEarth link enabled)
- Many people leave the links open even when not in use – e.g. the British Isles links show worldwide usage, notably over Russia.
- MGRS notably has high usage in two areas.
- The Far east likes to know what direction they facing.
Update: In a total forehead slapping momont realised these unprojected whole world images, are exactly what is used in GroundOverlays, so the the pages now include links to view the higher resolution images directly in Google Earth, duh!
Example:  View In Google Earth (don’t forget to try adjusting the tranparency slider!) [Update, to fix broken link, sorry!]
Tags: Coverage Maps, Google Earth, maps, Network Links
Posted in API, Coverage Maps, Experimental, Google Earth, KML, maps, Nearby, network-link, online maps, PHP, Web Services | Comments Off
Friday, February 29th, 2008
As some may know this site serves a number of Network Links for Google Earth, for a long time I have thought it would be fun to map the data from that, but finally got round to trying it. This is still work in progress, so the current images are very much easly tests, but shows promise, hopefully can make some better visualizations – maybe even as KMZ 
‘Lookat’ point v1: (click for 145k version)

View In Google Earth (don’t forget to try adjusting the tranparency slider!)
Shows some interesting patterns, there are a number of lines on the map, and definitily appears to be flight lines, I suspect this is from people leaving tours on loop, and a fudging a networklink to refresh periodically. Not sure how else to explain such repeatable loops – can a large number of visitors really be all following the same route? I’ll investigate this more in follow up map(s).
But WHAT is that point in the middle of the Atlantic?
Update: this is from about 900k hits from aug-nov ’07 – still processing the rest of the data!
Update 2: More maps here, all maps seem to to show the same overall pattern which is slightly puzzling, eg the IPs graph suggests that many users are following these flight lines.
Posted in Google Earth, Nearby, network-link, online maps | 3 Comments »
Sunday, November 4th, 2007
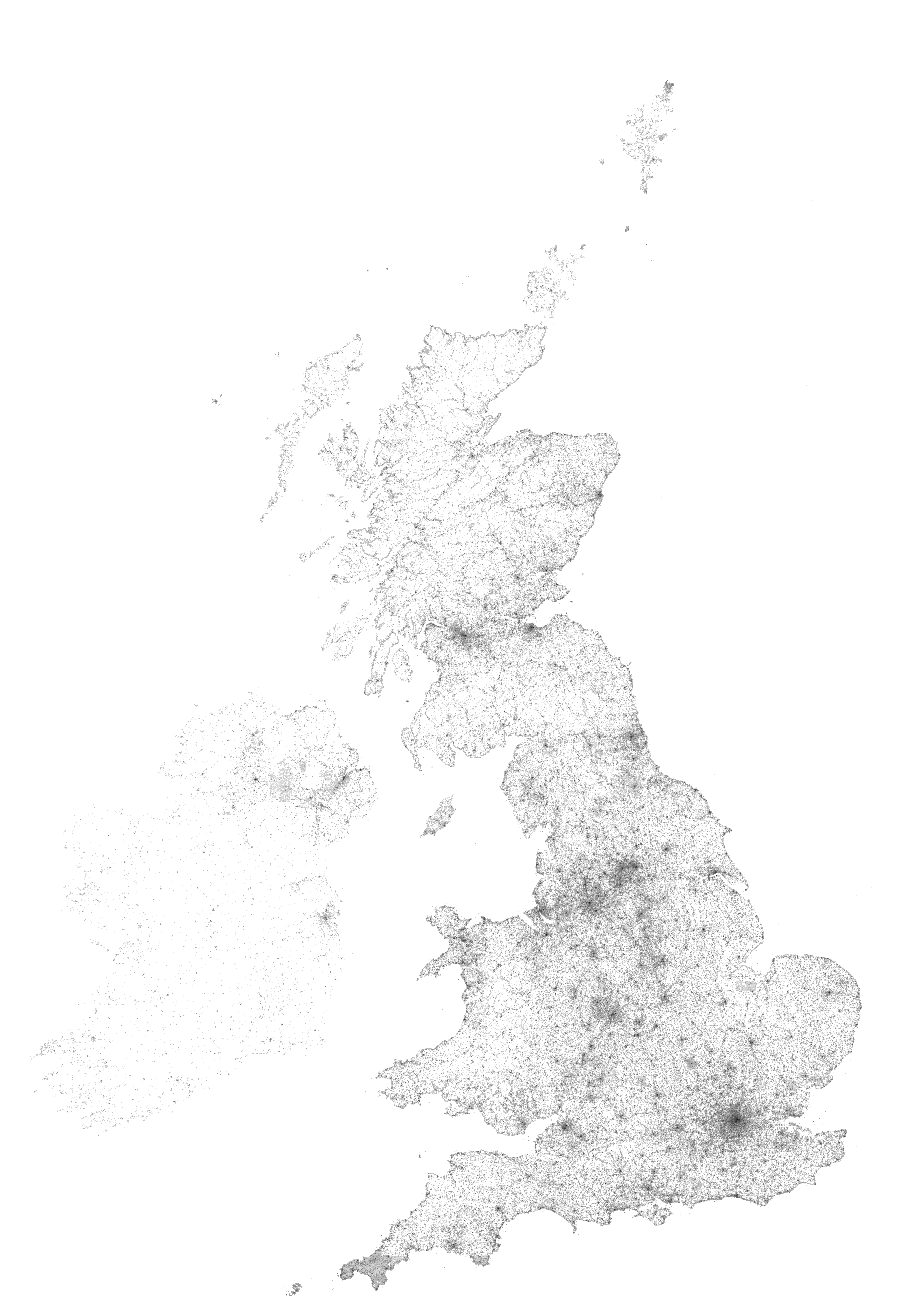
 It has to be said that when we started the Geograph British Isles project we certainly didn’t think it would grow quite a quickly as it has, nor that we could get such a submission rate, particulaly in adding depth – adding photos to a square once it was turned red on the map. Well to this end we recently introduced depth maps which colour the map based on the number of photos in the square. A preview is available here, but click the image for the normal Geograph map viewer in this new mode. Just goes to show how well photographed some areas are, but also a lot of the country only has the first geograph in the square, so much more depth to go!
Update: View as a time-based animation.
(includes raw frames as would like someone to make a better presentantion of this!)
btw, as I am colour-blind and unable to come up with the colour scheme, can only thank who ever created the colour scheme for CIS. (A very interesting package – worth playing with just for the data it has – I can provide a file to load geograph depth into it if interest!)
(yes the title is a tribute to this)
Posted in Geograph, maps, online maps | 1 Comment »
Wednesday, August 29th, 2007
Following the amazing interest in the networklink for embedding FlashEarth inside Google Earth 4.2, have performed a few updates…
- The zoom is a LOT closer matched, this is thanks to the inspiring formula: $z = (-1.4956 * log($range/1000) + 16.529; (yes really!); brought to you by the wonder of plotting a graph in Excel, creating a trendline, turning on the formula display option. Probably could get an even better match with more patience, but probably about as good as it going to get really.
- Removed the title and the directions links, makes the balloon looks a bit nicer, couldn’t get it to go transparent for me tho… suggestions welcome.
- When the network link is now a folder so can choose the size of your popup The previous version is now the ‘medium’ one.
Though the magic of the web, you get 1) and 2) automatically, if want 3) just download it again:
Open in Google Earth (Required: GE 4.2 Windows)
Thanks again to everyone involved.
Posted in Google Earth, network-link, online maps, PHP, update, Web Services | 2 Comments »
Monday, August 20th, 2007
Ever played Tetris? Know your geographical areas? If so then its time to play Statetris,
“Statetris is an interesting game mixing aspects of the popular game ‘Tetris’ and geography. Instead of positioning the typical Tetris blocks, you position states/countries at their proper location.”
…even better a UK version has just been released!
As the project diversifies to new areas, the creators are facing some interesting challenges to cope with our diverse world. For example the UK is a problem as its so tall, so doesn’t fit on screen as nice as some other areas, not to mention our confusing and changing geography! The Netherlands on the other hand is quite small, so has capitals added to add interest.
What’s your best time?
Posted in geo, maps, online maps, UK | Comments Off
Thursday, July 19th, 2007
.. or should.
I just stumbled* across this rather neat Google Map “Mashup”: Optimap, it attempts to solve the classic ‘Travelling Salesman’ problem, that is find the shortest route to take in an arbitrary list of locations, reordering the locations as appropriate. Doing this manually is tedious at best, but you can miss some useful shortcuts, it’s also no easy task for a computer to solve, but with some clever maths (more on the authors blog!), its possible for a computer to have a good stab at it.
Anyway try it out:Optimap
Only thing missing is import/export functions – wonder in fact if the author could push to get this integrated into the real Google Maps engine, that would be so cool!
(* actually I read about it in the Google Maps API group)
Posted in Google Maps, online maps | 4 Comments »
Thursday, March 22nd, 2007
All hail the new GGeoXml class, just introduced into the Google Maps API! Now you can easily (usually 1 or 2 lines!) add content that you have in KML/Z or GeoRSS to a Google Map in your API page.
This is the same functionality that has been on the main Maps site (well the GeoRSS support is new!) for a while: nice for this to migrate to the API.
TIP: to try it don’t forget to use &v=2.x in your api loader to get the latest version that includes the GGeoXml.
To celebrate here is a Geograph Demo – following some testing will make it an official feature.
Posted in Geograph, GeoRSS, Google Maps, KML, online maps, RSS | 2 Comments »


