Archive for the ‘maps’ Category
Saturday, December 18th, 2010
Recently Google deprecated Mapplets, which are little applications that ran on Google Maps. They have also now removed the Google Maps Directory.
However its still possible to run mapplets by a dedicated page (well at least for as long as V2 of the Google Maps API exists) – but no listing of mapplets available within Google Maps.

But fear not, I captured a copy of the mapplet list, and created a small crawler to fetch the details from the mapplets, and present them in a little searchable application:
Replacement Mapplet Directory
Admittedly the quality of the applications in the directory where always kinda variable, but there is some real gems in there, so at least preserving a listing I think is worthwhile, so they can be accessed if needbe.
Tags: Digital Preservation Project, Directory, Google Maps, Mapplets
Posted in Google Earth, Google Maps, KML, maps, Search | Comments Off
Sunday, January 3rd, 2010
The BGS recently publised the Geology of Britain website, which makes available a Geological map of Great Britain online in an interactive Map Viewer. They make available a 1:625 000 scale layer for Google Earth, and a the 1:50 000 scale version via WMS only.
Unfortunatly the WMS doesnt play nicely in Google Earth for some reason, so here is a hand tuned Google Earth layer to display the 1:50 000 scale Geological Maps:
http://gokml.net/2sc.kml
Enjoy!
Posted in Google Earth, KML, maps, network-link, UK, Uncategorized | 1 Comment »
Sunday, December 6th, 2009

Quite pleased with the latest update to the Geograph Clusters Map. This displays all geograph images on a interactive draggable Google Map. The clustering is powered by Geocubes  .
.
However the most exciting part of the update, is the ‘Enable Photo Display’ button. Which once clicked, enables loading a selection of thumbnails as you drag and move the map. Zoom in close enough to see many blue pins for best effect. As you move again, more images will load; the ones shown should always be within the current map view. The data to show images again comes from the Geocubes API, although we load actual thumbnails via our own API.
Tags: Geocubes, interactive, update
Posted in API, Coverage Maps, Geograph, Google Maps, maps | Comments Off
Sunday, September 6th, 2009
One of the things we been looking recently on Geograph, is guageing how ‘recent’ our coverage actually is. We impose no restriction on when photos where taken – because historical images are useful – not to mention every photo is historic by definition as soon as its taken!

Anyway the point of this post is in the process decided to try plotting a map showing the ‘age’ of the latest photo in a square – to see that recentness. The result is here:
OMG, quite aside from what it shows, it looks beautiful. (To my untrained eye!)
Click the image for a glorious 1px per km version.
© Copyright 2009 Geograph Project and licensed for reuse under this Creative Commons Licence. (if you want to do anything with it!)
Key: Age less than in years: (0 means no photos yet)

There is also a whole series of rendered maps from the project.
Tags: colours, coverage, Geograph, map, pretty, UK
Posted in Geograph, maps, online maps | 3 Comments »
Monday, June 22nd, 2009
Want to quickly access location based websites, while on the go?
Then enter:
m.nearby.org.uk
into your mobile browser.
Very privative, only goes to the nearby location links service, and a few pages on geograph. But between them give access to a fair number of (UK esp) websites.
Disclaimer: Only tested on a Google Android phone so far. Doesn’t seem to pickup GPS position (yet). To be honest surprised not found something like this in the Android Market.
If works out will probably add direct links to other websites, and possibly make it configurable so can choose which sites to show
Posted in Experimental, geo, Google Maps, Location Links, maps, Nearby | Comments Off
Monday, October 27th, 2008
In my travels I’ve come accorss many different photo websites, many of which I would like to explore further but dont have the time at the time. So as somewhere to keep note:
Geo Photo Websites
Any I have missed or should checkout? Let me know in comments…
Tags: geo, maps, photos, rfc, websites
Posted in geo, maps | Comments Off
Wednesday, August 13th, 2008
 As we near the Million mark on photos uploaded to Geograph British Isles, the coverage is really building up; and the project has definitly matured from just capturing a photo of every square (but that is still continuing!), to capturing each square in ‘depth’. We display the current coverage on the site as a depth map, but here we present some animations to watch the progress.
There are a number of interesting artefacts in this, if you are quick you can follow people as the hike long distance paths, but you can also see the people making concerted efforts to knock of hectads.
Of course the raw frames are available under Creative Commons, and a bonus prize to who can make an good mashup of these. The animations include both weekly frames, and monthly versions (labelled quick)
(the fire reference)

Tags: depth, Geograph, hot, maps
Posted in Coverage Maps, Geograph, maps, update | Comments Off
Sunday, March 2nd, 2008
 Just spotted a proposal for a standard icon to represent geotagged content, the homepage is at geotagicons.com, can’t say a big fan of the icon itself, but the idea is great.
<OT>Was sort of involved in trying to find a standard icon for GeoRSS (in fact they use my icon as the favicon  ), but not sure (in hindsight!) if that a good idea, really it just saying this is a geotagged feed, which really shouldn’t mean much different to the end user than the standard feed icon. If their feed reader is geoenabled – great, if not tough, although it can help people specifically looking for geo-content.</OT>
Anyway to try the waters, have enabled it for geotagged content on this blog, see the PhotoSpot category for example
(via)
Posted in Coordinate Converter, maps, Nearby | 4 Comments »
Saturday, March 1st, 2008
 Nearby Coordinate Converter >>>
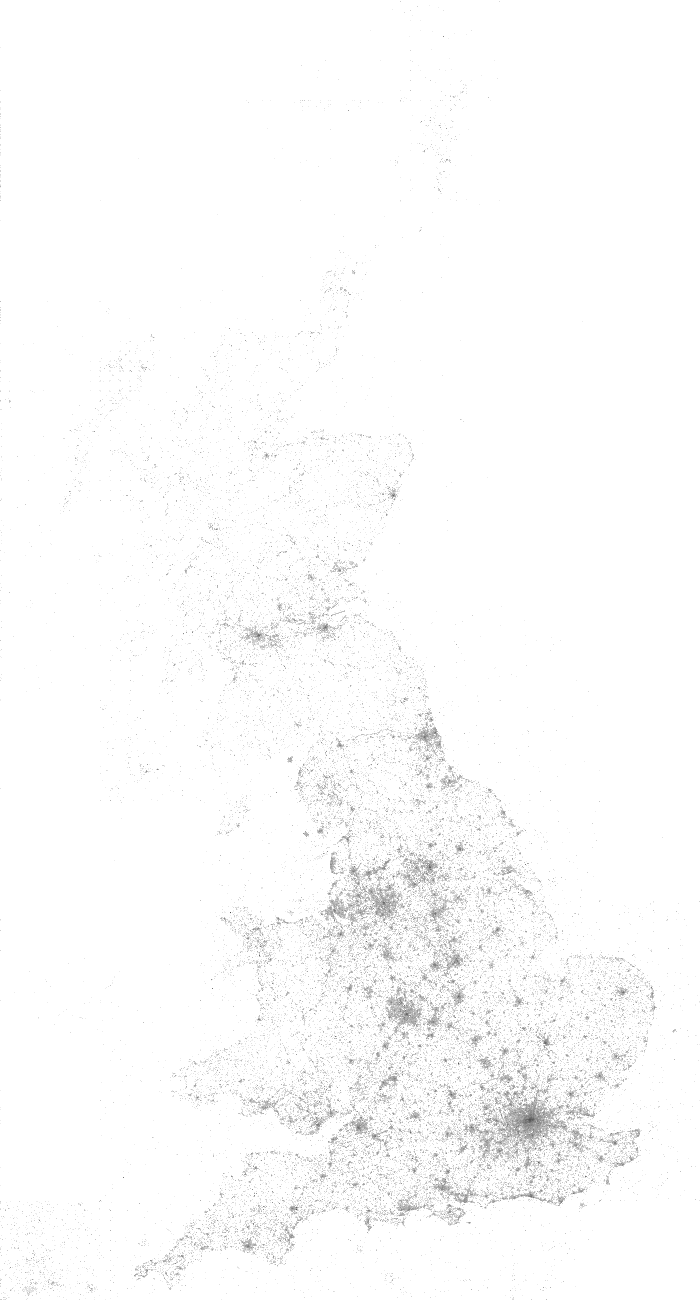
Following on from the Coverage map for Google Earth Layer usage, remembered I been keeping a log from the Coordinate Converter specifically for mapping (but only for GB) , but never actully got round to it, until now that is! Click the image for a full 1px per km version!

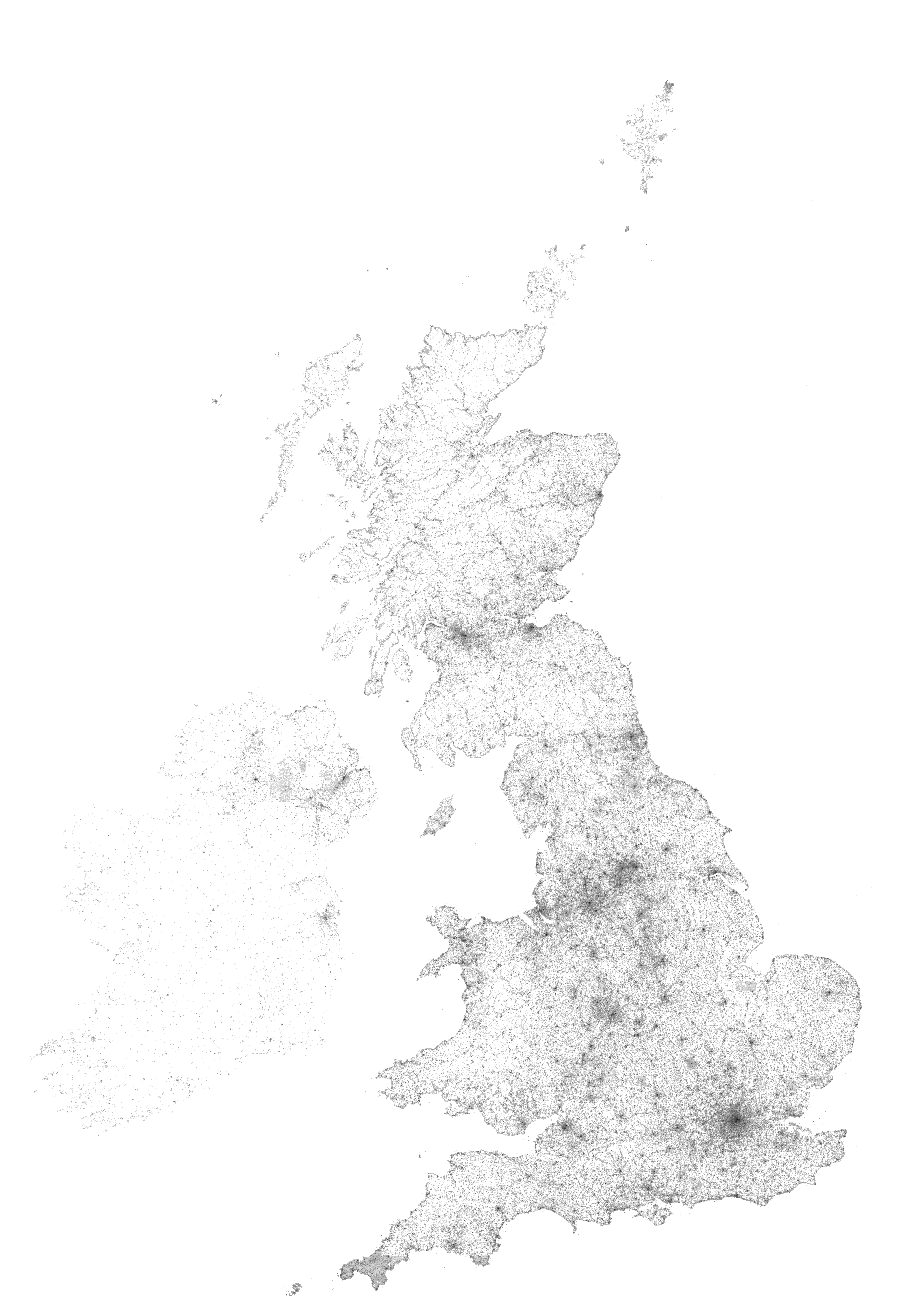
Update: Inspired by the above, heres one for the Geograph Search, ok so actully its for the British Isles!
<<<Geograph Searches
Posted in Coordinate Converter, maps, online maps, UK | 1 Comment »
Saturday, March 1st, 2008
Following part 1 yesterday, have now plotted some maps per individual service.
Flash Earth Layer

Conclusions
- Google Earth does request a link for the initial view on startup – that point in the Atlantic.
- I guess North American installs have two slightly different default placemarks; has it changed, or maybe Canada gets a different one?
- But that doesnt explain the lines from there – people must have their links set to periodically refresh?
- Germany likes FlashEarth (or rather people like looking at Germany with FlashEarth link enabled)
- Many people leave the links open even when not in use – e.g. the British Isles links show worldwide usage, notably over Russia.
- MGRS notably has high usage in two areas.
- The Far east likes to know what direction they facing.
Update: In a total forehead slapping momont realised these unprojected whole world images, are exactly what is used in GroundOverlays, so the the pages now include links to view the higher resolution images directly in Google Earth, duh!
Example:  View In Google Earth (don’t forget to try adjusting the tranparency slider!) [Update, to fix broken link, sorry!]
Tags: Coverage Maps, Google Earth, maps, Network Links
Posted in API, Coverage Maps, Experimental, Google Earth, KML, maps, Nearby, network-link, online maps, PHP, Web Services | Comments Off


